Weekly Stock Market Update 8/30

SPY traded strong for the week and tagged that 450 target into Jackson Hole friday I had been looking for. This market continues to be relentless with dip buying as long as the 8 and 21 EMA’s are pointing up and this week the impressive development was positive breadth readings on 4 of the 5 days. Stronger breadth continuing to start September would be a positive sign that the rally is broadening to more sectors and industries. The small caps had a fantastic 5% rally this week with IWM Russell 2000 regaining its 8/21 weekly EMA’s as well. This group could lead the next leg higher as it has consolidated for 6 months and poised to break out. Perhaps being long Russell small caps and growth names could be getting ready to be the trade. Also watching ARKK should be important as it is getting stronger and could start a larger upside move especially if its largest weighting TSLA can finally clear that 725 volume resistance. This is what I am positioning for overall until the charts say otherwise. Some of the best trades emerge when sentiment is more bearish leaning while price refuses to go lower, instead dips and shakeouts fake out weak longs and provide fuel for upside.

This week with Jackson Hole behind the markets, it will be a slower week but still Jobs report Friday the big catalyst along with some ISM and PMI econ data. Earnings reports of note from ZM, CRWD, DOCU, AVGO, OKTA, CHWY, MDB, FUTU, ASAN, PLAN, CIEN, STNE.

3 PEAKS MARKET SIGNALS OVERVIEW:

TREND- The short and long term trend of the market being bullish biased increases the odds of pullbacks being good buy opportunities.

SPX Short term trend of the 8/13/21 EMA’s. The 8 EMA is above the 13 EMA which is above the 21 EMA = Strong bullish trend.

SPX Long term trend of the 21/55/89 EMA’s. The 21 EMA is above the 55 EMA which is above the 89 EMA = Strong bullish trend.


CONDITION/BREADTH- SPX MACD Daily Momentum is back above zero and RSI is 64, still below previous highs and showing bearish divergences.

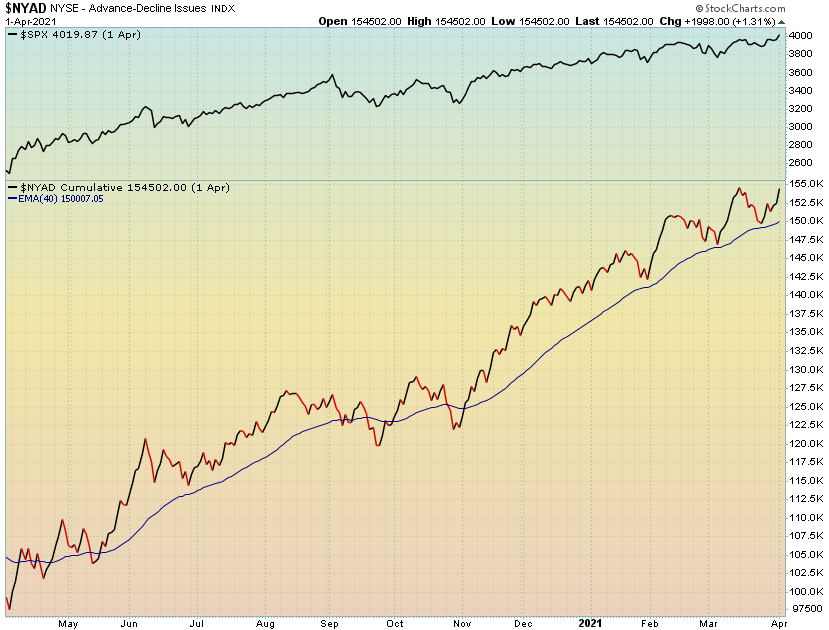
Cumulative Breadth Advance/Decline line recovered last week overall to add +2163 and closed above the 40 EMA. Breadth improving. NYSI Summation index trying to get that bull cross back above the 8 day MA. New 52 week highs on NYSE had 165 new highs on Friday and the 20 day average is 137. There were 32 new 52 week lows, a nice decrease from past few weeks.


SENTIMENT- AAII Investor sentiment survey Bullish sentiment rose to 39.6% Bulls from 33.2% last week. Bears ticked down to 33% from 35.1% last week. Bulls/bears ratio at 1.20.

Sentiment data is looked at as contrarian and Bullish signals occur when Bulls drop under 35%, or when Bears rise above 50%. Bearish signals occur when Bulls exceed 55% or if Bears drop under 20%.

S&P SPY Sector Glance:

10 of 11 S&P sectors are back in strong bullish short term trends as shown below. Energy the only sector in a bear trend and could potentially be trying to recover as it was strongest this week +7.5%. XLRE Real estate looking poised to break higher out of a coiled squeeze pattern. Fairly broad based rally this week with 6 sectors up 2% or more. Overall SPX up +1.52% for the week.

2021-08-29_11-44-49.png

SEASONALITY ODDS:

This week seasonality shows potential weakness to start the week then somewhat stronger by end of week. 1st trading days of the month are generally positive but August and September are an exception to this rule as both months have been weaker on the 1st trading day of the month. Overall the following week after Labor Day holiday is stronger with markets up around 60% of years going back 21 years. This continues into triple witching options expiration week for September.

Seasonality odds are just tendencies based on historical patterns but always let price action confirm any trade setups.

2021-08-29_11-45-49.png

Inside week bullish setup: Stocks that stayed within the high and low of its prior week. A break above these highs could trigger larger moves for fresh opportunities.

Home Construction ETF (ITB)

ITB has been forming a bullish weekly squeeze setup and the inside week candle last week sets up potential breakout towards 80-82. October 75 calls at 2.00 or better could be a solid risk/reward the next several weeks.

Bull Put Spread Trade of the Week:

Square (SQ)

Sell the October 260/250 put spread for 3.50 or better. Earnings not due out til after Oct expiration.

SQ was a good bull put spread trade I posted back in July so going back to the well with this clean uptrend looking to extend higher into 300. SQ has pulled back from 289 highs and the rising 50 day MA should hold as support on dips as all EMA’s are stacked positive and growth stocks have been strengthening so fairly good odds SQ can sustain above 260 into September.

Individual Stock Scans of note: Sorted by Market Cap

Weekly inside candles: AAPL, MSFT, UNH, HD, DIS, NKE, XOM, WFC, COST, CVX, SE, QCOM, HON, SBUX, BA, RTX, IBM, TGT, BUD, DE, CAT, BP, COF, FISV, CME, FDX, TWLO, FCX, EPD, NEM, WBA, HOOD, DD, AFL, KKR, CNC, CHWY, NTR, MT, DHI, ADM, LEN, VFC, WMB, VIAC, HIG, FOXA, TTWO, LBTYK, CAH, APO, DBX, MOS, CLF, TPR, UAA, UA, CF, NTNX, CHPT, FL, SONO, APPS, SEAS, FUBO, SPWR, WW, BLNK

8/21 EMA Daily Bull Cross: TSM, RDS/B, PDD, GE, ERIC, NTR, MT, PATH, DAL, OKE, IP, CFG, BBWI, BMRN, HTHT, PHM, HWM, EQH, TPR, IVZ, HST, CIEN, OVV, BRX, PK, IGT, VIAV, FNB, IOVA, CARG, SSRM, MOMO, RMBS, ABR, BLMN, ROIC, PRCH, TTCF, PBF

8/21 EMA Daily Bear Cross: BMY, DUK, VMW, DG, K, BURL, DLTR, RKT

Stocks compressing in TTM Squeezes within 10% of 52 week highs: AAPL, CMCSA, ORCL, AVGO, SHOP, MCD, HON, AMD, SQ, SNAP, SPGI, ADI, DOCU, NOC, GD, EA, NET, YUM, DHI, LEN, MCK, IP, DISH, CLF, FLEX, YETI, CSTM

55 day Highs with strong closes: GOOGL, NVDA, JPM, ACN, AVGO, MS, LIN, SCHW, GS, TEAM, BX, PNC, WM, AON, EMR, NXPI, CARR, EBAY, BK, BCE, APH, CDNS, PANW, STM, RSG, XLNX, ZS, STT, SYF, WY, HIG, LNG, HOLX, PAGS, PFG, NUAN, DKS, CMA, ZION, JEF, SEE, JHG, PLNT, AMKR, AZEK, FSK, QTS, ALKS, NAVI, GENI, MIC

Weekly Stock Market Update 8/23

The SPX had a volatile options expiration week as has been the trend this year. Pulling back about 100 SPX points into a Thursday gap down which found support near 4375 and recovered back above the key 4400-4420 zone. The should be a key downside level going forward still as it likely forces market makers to sell in order to hedge below that zone. If the SPX can stay above the 8/21 EMA’s it can retest highs and potential for that 4500 still. However with momentum declining on both the weekly and daily charts shown and breadth still suspect and bearish its still a market that needs to prove itself for sustained upside moves to hold. This week the big Jackson Hole Fed meeting starts Thursday so clearly a week with a lot of potential risk of volatility, both upside and downside. While the SPX is holding firm above that key 4400 most of August thus far, the small caps IWM continue to weaken, closing below the 21 week EMA. The Nasdaq tech index QQQ likely holds the key to where markets want to go into September so should be watched closely. As usual the VIX has been a good clue day to day to watch for any concerns on the shorter timeframe. It quickly got above its upper bollinger band last week and was short term extended helping the SPY bounce back. If VIX creeps back above 20 it will be a red flag for volatility increasing again. Some names reporting earnings this week include CRM, INTU, SNOW, PTON, BBY, PANW, WDAY, HPQ, DELL, ADSK.

3 PEAKS MARKET SIGNALS OVERVIEW:

TREND- The short and long term trend of the market being bullish biased increases the odds of pullbacks being good buy opportunities.

SPX Short term trend of the 8/13/21 EMA’s = Strong bullish trend

SPX Long term trend of the 21/55/89 EMA’s = Strong bullish and EMA’s stacked positive.


CONDITION/BREADTH- SPX MACD Momentum is below zero and RSI is 57, still below previous highs and showing bearish divergences.

Cumulative Breadth Advance/Decline line declined last week overall even with small positive breadth on Friday. Breadth staying weak. NYSI Summation index bearish cross back below the 8 day MA is sign for caution. New 52 week highs on NYSE had just 79 new highs on Friday and the 20 day average is 143. There were 96 new 52 week lows, which has slowly been increasing, unusual to see with the market at new highs and a bearish sign.


SENTIMENT- AAII Investor sentiment survey Bullish sentiment fell to 33.2% Bulls from 37.0% last week. Bears ticked up to 35.1% from 31.5% last week. Bulls/bears ratio at 0.95.

Sentiment data is looked at as contrarian and Bullish signals occur when Bulls drop under 35%, or when Bears rise above 50%. Bearish signals occur when Bulls exceed 55% or if Bears drop under 20%.

NYSE cumulative breadth struggling

NYSE cumulative breadth struggling


S&P SPY Sector Glance:

8 of 11 S&P sectors are in strong bullish short term trends as shown below. Some decent weakness in Discretionary and Industrials last week pushed them into short term bearish trends. XLY being a fairly large weighting makes it notable. The highest weighted sectors ( Tech, Healthcare) staying strong. Overall Utilities and Healthcare the strongest sectors this week up +1.8% each. Energy -7% and Materials -3% the weakest. SPX down -0.59% for the week.

2021-08-22_14-16-39.png

SEASONALITY ODDS:

The week after August options expiration shows potential weakness to start the week then somewhat stronger by end of week. Its been a fairly choppy month overall and now headed into month end it may continue as seasonality is mixed between each index. A decent chance for history to repeat with one day up, next day down, type of pattern to play out.

Seasonality odds are just tendencies based on historical patterns but always let price action confirm any trade setups.

Inside week bullish setup: Stocks that stayed within the high and low of its prior week. A break above these highs could trigger larger moves for fresh opportunities.

Datadog (DDOG)

DDOG has been in a strong uptrend and gapped up post earnings while the Software sector stays strong as well. The stock formed an inside week candle last week and in a strong market likely takes out the highs above 137 and continues higher. For momentum need to wait for 137 trigger, conversely can always try a bounce trade off the rising 21 EMA if that happens first. October calls slightly in the money would be a good potential trade to watch.

Bull Put Spread Trade of the Week:

Trade Desk (TTD)

Sell the October 77/72 put spread for 2.25 or better.

TTD is pulling back to its 50 and 200 day MA’s while it filled a gap into 75. Would expect the 200 day MA to hold as support in the coming weeks as it continues making higher lows the last several months. This could easily retest its highs of 90 in a strong market or at least stay above the 75-77 level for this bull put spread to work.

Individual Stock Scans of note: Sorted by Market Cap

Weekly inside candles: BAC, UNP, MU, CSX, COF, ATVI, MET, WBA, DDOG, CTSH, SYY, CNC, NUE, TSN, DLTR, WPM, NVAX, SAVA

8/21 EMA Daily Bull Cross: NVDA, JWN, SIG

8/21 EMA Daily Bear Cross: HON, ABNB, PNC, MPC, NTR, NTAP

Stocks compressing in TTM Squeezes within 10% of 52 week highs: AAPL, GOOGL, NVDA, HD, CMCSA, KO, AVGO, HON, BMY, INTU, NOW, MO, BX, HCA, VMW, ADI, GD, MRVL, ROST, NET, HSY, ZS, LEN, YNDX, IP, DISH, DKS, THC, CSTM

55 day Highs with strong closes: MSFT, NVDA, JNJ, UNH, CMCSA, CSCO, ACN, COST, NEE, LIN, BMY, LOW, AMT, INFY, PLD, TJX, CB, MMC, EW, ADSK, SO, D, WM, AMX, JCI, EXC, AEP, APH, CDNS, RSG, KR, BLL, WEC, DTE, ETR, PPL, EIX, ROL, CMS, NUAN, BRO, EVRG, LNT, CCK, NYT, BJ, ALKS, OPCH

Weekly Stock Market Update 8/16

SPX had a very quiet week again closing at new highs as the melt up from 4400 continues into mid August. I have been looking to lighten up bullish positions into this 4450 zone if it got there before options expiration and it has so the prudent plan going into this week is to take gains off the table and look for potential mild pullbacks towards 4400 which is very strong support until it breaks. There has been a lot of “gamma” or option open interest building up at 4400-4425 on ES_F futures the last several weeks. We saw price grind its way through the upside of that zone finally but as you can see from the SPY chart below its above the 2 ATR band (blue line) which generally has led to a pause or pullback to the 21 EMA (dashed line). I like to look at these Keltner Channel bands to see when the market is extended from its mean, or the 21 EMA, which now sits just under 440 SPY (or 4400 on the ES futures). With August options expiring Friday this week it could lead to some unwinding of positions ahead of the Jackson Hole Econ meeting Aug 26-28th. The VIX volatility index has been under big pressure with the contracting realized volatility in the market so that will be key to watch again if it starts to level out near this 15 area. Earnings reports quiet down this week but still some key growth and large cap names reporting like NVDA, SE, WMT, HD, LOW, TGT, RBLX, CSCO, AMAT, HOOD.

3 PEAKS MARKET SIGNALS OVERVIEW:

TREND- The short and long term trend of the market being bullish biased increases the odds of pullbacks being good buy opportunities.

SPX Short term trend of the 8/13/21 EMA’s = Strong bullish trend

SPX Long term trend of the 21/55/89 EMA’s = Strong bullish and EMA’s stacked positive.


CONDITION/BREADTH- SPX MACD Momentum is above zero and RSI is rising to 67, still below previous highs and showing bearish divergences.

Cumulative Breadth Advance/Decline line still below new highs slightly. NYSI Summation index saw a positive cross above the 8 day MA. New 52 week highs on NYSE had 169 new highs on Friday and the 20 day average is 144. There were 44 new 52 week lows, which has slowly been increasing, unusual to see with the market at new highs.

SENTIMENT- AAII Investor sentiment survey Bullish sentiment stayed low at 37.0% Bulls from 36.1% last week. Bears to 31.5% from 31.7% last week. Bulls/bears ratio at 1.17.

Sentiment data is looked at as contrarian and Bullish signals occur when Bulls drop under 35%, or when Bears rise above 50%. Bearish signals occur when Bulls exceed 55% or if Bears drop under 20%.

S&P SPY Sector Glance:

10 of 11 S&P sectors are now in strong bullish short term trends as shown below. Basic Materials joined the party last week with strong move up which just leaves Energy as the laggard in a downtrend, but one of the smallest weightings in the index also. The highest weighted sectors ( Tech, Healthcare, Discretionary, Financials, Communications) hold the key to the market as a whole going forward. Transports had a large bounce back last week also which is a positive. Overall Materials led the strength this week up +2.8% with SPX up +0.71% for the week.

2021-08-15_14-14-33.png

SEASONALITY ODDS:

August options expiration week shows good potential for bullish bias into early to midweek before Thursday weakness. Nasdaq has tended to be strongest during August OPEX week so maybe see some more follow through from last week’s Nasdaq bounce helped by Bonds rallying. Next week after options expiration shows potential weakness to start week then somewhat stronger by end of week. Seasonality odds are just tendencies based on historical patterns but always let price action confirm any trade setups.

Inside week bullish setup: Stocks that stayed within the high and low of its prior week. A break above these highs could trigger larger moves for fresh opportunities.

Pepsi (PEP)

Consumer Staples started to break out last week as the XLP showing strength. Its a boring name PEP can move to 160 out of this bigger weekly breakout that is underway. Inside week candle last week and staying above 154 a bullish sign. The Sept 155 calls at 3.00 a cheap way to potentially play new highs.

Bull Put Spread Trade of the Week:

Netflix (NFLX)

Sell the Sept 515/510 put spread for 2.25 or better.

NFLX has been a rangebound stock much of the year spending time between 490-540. It has tended to bounce off low 500s and head back to 540 so trading the range through bull put spreads is a good way to play the choppy bounce potential. The daily and weekly chart is forming a compression squeeze which looks to be pointing higher with momentum rising so eventually this could break higher longer term also.

2021-08-15_14-51-32.png

Individual Stock Scans of note: Sorted by Market Cap

Weekly inside candles: NVDA, PG, PYPL, NKE, NFLX, PEP, TMUS, MCD, AMD, AXP, RTX, SQ, SPGI, MDLZ, UBER, GM, COP, FISV, CI, CL, ADI, NTES, KHC, HOOD, EA, XLNX, PSX, VFC, LVS, WMB, VLO, VIAC, HRL, ETSY, OXY, EXPE, CLX, AKAM, ON, HAL, LYFT, AMC, CPB, DBX, CTXS, PENN, WYNN, BHC, JNPR, MAT, WOOF, FSLY, SEAS, SPWR, CWH

8/21 EMA Daily Bull Cross: AMT, BSX, EBAY, KMB, RKT

8/21 EMA Daily Bear Cross: SHOP, AXP, SOFI, PENN, CREE, FSR, MVIS, GPRO, BLNK

Stocks compressing in TTM Squeezes within 10% of 52 week highs: AAPL, UNH, CMCSA, KO, VZ, PEP, SHOP, AZN, TMUS, TXN, HON, BMY, AXP, AMT, IBM, MMM, GE, MO, GILD, CME, ITW, VMW, DOCU, HSY, OKE, IP, THC, URBN

55 day Highs with strong closes: MSFT, GOOGL, JNJ, ADBE, PFE, CSCO, NVO, DHR, ABT, TMO, ACN, COST, NEE, LIN, PM, UNP, INTU, GSK, INFY, PLD, GILD, SNOW, CB, COF, MMC, ABB, DASH, WM, ECL, AON, UBS, AMX, TEL, A, EBAY, EXC, BCE, AEP, APH, CDNS, PAYX, CTSH, DFS, YUM, IFF, STM, RSG, U, PEG, ES, SYF, O, FTV, HIG, AEE, PPL, IR, CMS, ACGL, LBTYK, LBTYA, CNP, EVRG, LNT, MRVI, CCK, FNF, DAR, VER, XPO, FSLR, CROX, PLAN,

Weekly Stock Market Update 8/9

SPX had a fairly quiet week staying within its expected move even with Fridays break to new highs, although Nasdaq being weaker Friday on the back of strong jobs report boosting bond yields. This is going to be key to watch this week if interest rates start climbing back above 1.3% and spooks growth stocks more or if its just a short term move that quiets down ahead of the more important Jackson Hole Econ meeting the last week of August. While last week’s move to new highs wasn’t super powerful with a big thrust as I would have expected towards 4450, it still closed at new all time highs so need to respect the trend that is. This week’s expected move is +/- 65 SPX points based on the weekly options pricing. That would take it to 4500 roughly on a up move. While the downside would potentially find support near the 21 ema at 4375. Its the week prior to August monthly options expiration so wouldn’t be surprising to see some late week pullback which is typical. Friday also saw a key break lower in volatility markets with the VIX closing under 17 for the first time in about a month. This should be a clue that stocks may grind higher into expiration week, after that may be a time to be more cautious and expect higher volatility ahead of the Jackson Hole meeting. Over the years while I have traded I can remember several late August selloffs that came out of nowhere. Its just a time to be less exposed directionally and focus on more neutral premium selling if anything.

TNX 10 year yields. Poking above 21 ema but still in solid downtrend since Spring

3 PEAKS MARKET SIGNALS OVERVIEW:

TREND- The short and long term trend of the market being bullish biased increases the odds of pullbacks being good buy opportunities.

SPX Short term trend of the 8/13/21 EMA’s = Strong bullish trend

SPX Long term trend of the 21/55/89 EMA’s = Strong bullish and EMA’s stacked positive.


CONDITION/BREADTH- SPX MACD Momentum is above zero and RSI is 62, although both are lower than they were the last time SPX made new highs in July. Bearish divergence.

Cumulative Breadth Advance/Decline added some strength last week but still below new highs slightly. NYSI Summation index trying to curl higher and cross above the 8 day MA. Also the Nasdaq version NASI trying to cross positive as well. New 52 week highs ticked up a bit last week as NYSE had 183 new highs on Friday and the 20 day average is 138. There were 35 new 52 week lows.

SENTIMENT- AAII Investor sentiment survey Bullish sentiment stayed low at 36.1% Bulls from 36.2% last week. Bears up to 31.7% from 24.1% last week. Bulls/bears ratio at 1.14.

Sentiment data is looked at as contrarian and Bullish signals occur when Bulls drop under 35%, or when Bears rise above 50%. Bearish signals occur when Bulls exceed 55% or if Bears drop under 20%.

S&P SPY Sector Glance:

9 of 11 SPY sectors are in strong bullish short term trends as shown below. Basic Materials also close to confirming strong bull trend which just leaves Energy as the laggard in a downtrend. Transports also continue their downtrend which may be a longer term issue into end of year for broad market. Overall Financials led the strength this week up +3.7% with SPX closed up +0.94% for the week.

2021-08-08_11-53-49.png

SEASONALITY ODDS:

Second week of August is a bit weaker midweek until around the Friday before options expiration week which then shows good potential for bullish bias into OPEX week. Nasdaq has tended to be strongest during August opex week. Remember these are just tendencies and I always let price action confirm any trade setups.

2021-08-08_12-12-21.png

Inside week bullish setup: Stocks that stayed within the high and low of its prior week. A break above these highs could trigger larger moves for fresh opportunities.

Apple (AAPL)

AAPL continues to consolidate nicely post earnings above its 21 ema. Inside week candle last week with a small range under 3 pts. A break above 148 can trigger a move to 151-152 new highs. A close under 145 and this setup is invalid. Buying the 147/150 call spread for Aug is a easy way to risk 1 to make 2 on the upside.

2021-08-08_12-26-28.png

Bull Put Spread Trade of the Week:

Twitter (TWTR)

Sell the October 67.5/62.5 put spread for 2.00 or better.

TWTR has been spinning sideways to lower since earnings and the rising 50 day MA below at 65.50 should be supportive going forward. The daily chart is forming a squeeze which usually resolves higher when the trend is above the 50/200 day MA’s.

Individual Stock Scans of note: sorted by market cap

Weekly inside candles: AAPL, MSFT, GOOGL, PG, INTC, CVX, TMUS, UPS, UNP, BA, SNAP, MMM, CAT, PDD, WDAY, BIDU, TWTR, VRTX, SPOT, PLTR, CTSH, NET, MT, VFC, SWKS, VLO, WY, TDOC, IP, FUTU, PHM, CTXS, CLF, MOS, TECK, QS, X, SPWR, SAVA, FUBO, STEM, BLNK

8/21 EMA Daily Bull Cross: JPM, C, BP, PNC, WDAY, MET, MNST, MOS, SEAS

8/21 EMA Daily Bear Cross: ANTM, MO, NIO, BDX, PTON, SWKS, RVLV

Stocks compressing in TTM Squeezes within 10% of 52 week highs: AAPL, JPM, UNH, CMCSA, ORCL, ABBV, AVGO, TXN, HON, BMY, UNP, AXP, AMT, GE, MMM, MO, GILD, USB, TJX, PNC, CME, COF, PBR, ITW, REGN, CRWD, ROST, AIG, EA, DFS, PANW, SWKS, SYF, KMX, TSCO

55 day Highs with strong closes: MSFT, ADBE, DHR, ABT, ACN, WFC, MS, NEE, GS, BAM, ADP, CB, ADSK, EW, DG, A, BCE, PAYX, YUM, KKR, XP, ALB, TXT, ACGL, IPG, VOYA, NAVI, LTHM

Weekly Stock Market Update 8/2

After a week of big events between the FOMC meeting and monster tech earnings reports the SPX had a relatively quiet range for the week closing slightly lower overall. Interestingly however, the VIX index closed the week higher and really did not get crushed after FOMC and key earnings reports passed. It still seems like SPY and QQQ is having a tough time staying at new highs lately. SPY closed the week right at its 8 ema, after making a new high briefly above 440. July was a positive month overall but led by just those handful of mega cap stocks. One of which crashed and burned after earnings in AMZN. If these tech names start to falter the market will need to see rotation to further lead the upside, otherwise increased risk of a sharp pullback increase. August can tend to see volatility and that seems like what the VIX is pricing in still. August thru September generally sees the best odds for bearish markets as well so being near the highs with faltering momentum signals doesn’t make it a great risk/reward to be loading up on new bullish trades. Being selective and ready to buy off lower supports likely will be a good way to focus ahead. Options market is pricing in a SPY move of $6.25 this week.

3 PEAKS MARKET SIGNALS OVERVIEW:

TREND- The short and long term trend of the market being bullish biased increases the odds of pullbacks being good buy opportunities.

SPX Short term trend of the 8/13/21 EMA’s = Strong bullish trend

SPX Long term trend of the 21/55/89 EMA’s = Strong bullish and EMA’s stacked positive.


CONDITION/BREADTH- SPX MACD Momentum is above zero and RSI is 58, although both are lower than they were the last time SPX made new highs in July. Bearish divergence.

Cumulative Breadth Advance/Decline line rebounded last week but still failed to make new highs with SPX. NYSI Summation index showing some signs of trying to bottom out but still remains below its 8 day MA. New 52 week highs have been lagging with SPX near highs. Ticked up a bit last week as NYSE had 196 new highs on Friday and the 20 day average is 135.

SENTIMENT- AAII Investor sentiment survey Bullish sentiment ticked up to 36.2% Bulls from 30.6% last week. Bears down to 24.1% from 30.6% last week. Bulls/bears ratio at 1.50.

Sentiment data is looked at as contrarian and Bullish signals occur when Bulls drop under 35%, or when Bears rise above 50%. Bearish signals occur when Bulls exceed 55% or if Bears drop under 20%.

S&P SPY Sector Glance:

8 of 11 SPY sectors are in strong bullish short term trends as shown below. Basic Materials sector led things this week as Tech and Discretionary pulled back due to weak earnings in names like AMZN and FB. SPX closed down -0.37% for the week.

2021-08-01_14-08-37.png

SEASONALITY ODDS:

The last week of July did end up being weaker as the calendar suggested. The first week of August is also a bearish bias but quite mixed with the Nasdaq weaker than S&P over the years. Looking into the second week of August, that weakness persists further until around the Friday before options expiration week shows good potential for bullish bias. Remember these are just tendencies and I always let price action confirm any trade setups.

2021-08-01_14-31-03.png

July inside month candles: Stocks that stayed within the high and low of its prior month. A break above these highs could trigger larger moves for fresh opportunities.

WFC, GS, MMM, DE, GSK, MO, USB, COF, ITW, SO, RACE, VRTX, COIN, BIIB, EA, GLW, SWK, BBY, RNG, URI, DLTR, AMC, EXAS, CNP, CBOE, CRSP, CIEN, NTNX, SPCE, AEO, FSLY, FEYE, FUBO, CWH, EGHT

Bull Put Spread Trade of the Week:

Peloton (PTON)

Sell the August 120/115 put spread for 2.50 or better. Earnings not due out til late August after Aug opex.

PTON has been pulling back to its 21 week EMA and consolidating in its June price range after the early summer rally. The 50 day MA has been supportive on dips and looking for that to hold again near 115. The weekly chart is forming a squeeze that is compressing and ready to fire to the upside soon.

Individual Stock Scans of note:

Weekly inside candles: NVDA, HD, ADBE, KO, ORCL, CRM, VZ, NFLX, AZN, TXN, HON, SBUX, UNP, LOW, AXP, SCHW, IBM, SNAP, SQ, USB, HCA, CSX, TWLO, D, DOCU, CRWD, DASH, TWTR, MET, MNST, KMB, MTCH, EOG, AIG, DD, PPG, PTON, LUV, DAL, ETSY, OKE, CLX, AMC, MGM, CZR, PLUG, CREE, SKX, KSS, BYND, FL, AEO, JWN, FEYE, SPWR, BBBY

8/21 EMA Daily Bull Cross: GSK, ADI, NXPI, COIN, LI, HIG, ON, CBOE, TECK, JNPR, FLEX, CWH, RIOT, CSTM

8/21 EMA Daily Bear Cross: AMZN, PYPL, AMGN, LOW, MMM, VALE, CL, D, PINS, AAL

Stocks compressing in TTM Squeezes within 10% of 52 week highs: AAPL, JPM, WMT, UNH, CMCSA, VZ, ABT, ABBV, AVGO, TMUS, TXN, BMY, SE, AXP, AMAT, GS, IBM, MMM, CVS, VALE, SPGI, LRCX, MO, GILD, TJX, COF, ITW, CRWD, JCI, BK, MTCH, EA, DFS, AFL, DDOG, NTR, SWKS, SYF, HIG, TSCO, LBTYK, CNP, NRG, JNPR

55 day Highs with strong closes: NKE, ABT, COST, MDT, HON, LIN, INTU, SPGI, INFY, ADP, SHW, BDX, ADSK, ETN, EMR, MRVL, TT, TEL, CARR, INFO, A, APH, PAYX, CDNS, YUM, RSG, IFF, ROL, DGX, PNR, ALKS, MIC, CVA

Weekly Stock Market Update 7/26

The SPX finds itself at new highs into a very busy week of catalysts after starting last week with a big gap down Monday it recovered all of those losses by the end of the week. The common theme on these selloffs has been buyers coming at the 50 day moving average for months now and sentiment quickly shifting bearish too fast to sustain much of a drop. If the market falls for a week and sentiment stays bullish then its more likely to continue falling for a larger correction eventually. But if everyone is getting short after a day or two of pullback, its so much more likely to bounce back. Heading into this week will be interesting to watch if profit taking comes in at these new highs ahead or after the FOMC meeting Wednesday and lots of big earnings reports coming from tech names. Last week’s lows on SPX were 4233 and will be a key level going forward the rest of summer to see if prices can sustain the rebound, on the upside when you see prices V bottom like this to new highs, those previous highs near 4390 become important to see if price is accepted above for more than a few days and eventually value building above 4400 on the profile would be bullish for longs. The weekly chart on right below shows how often the SPX has tested and bounce off the 10 week MA (equal to the 50 day MA) this year and until it closed a weekly candle below that and confirms the following week you can’t get too bearish on this market for more than a quick trade. Watching the VIX this week will be key as usual since it did not make new lows as the market made new highs. Options market expected move for this week in SPX is about +/- 68 point range.

SPX daily and weekly chart view

US Econ calendar this week a busy one, highlighted by FOMC interest rate statement midweek

3 PEAKS MARKET SIGNALS OVERVIEW:

TREND- SPX Short term trend of the 8/13/21 EMA’s = Strong bullish trend

Long term trend of the 21/55/89 EMA’s = Strong bullish and EMA’s stacked positive.


CONDITION/BREADTH- SPX MACD Momentum is trying to curl back up and RSI is 63, although lower than it was the last SPX made new highs. Bearish divergence.

Breadth Cumulative Advance/Decline line broke to new recent lows early last week with the selloff and rebounded but still failed to make new highs with SPX. This continues to be a warning as well as NYSI Summation index not bouncing back up with this recent snapback rally. New 52 week highs have been lagging with SPX near highs. NYSE had 147 new highs on Friday and the 20 day average is 145.

SENTIMENT- AAII Investor sentiment survey Bullish sentiment ticked down to 30.6% Bulls from 36.2% last week. Bears up to 30.6% from 26.8% last week. Bulls/bears ratio at 1.00.

Sentiment data is looked at as contrarian and Bullish signals occur when Bulls drop under 35%, or when Bears rise above 50%. Bearish signals occur when Bulls exceed 55% or if Bears drop under 20%.

S&P SPY Sector Glance:

8 of 11 SPY sectors are in strong bullish trends as shown below. Communications sector led the rally mostly thanks to strong action from internet stocks and social media names. SPX closed up +1.96% for the week

2021-07-25_18-16-14.png
2021-07-25_18-23.png

SEASONALITY ODDS:

The last week of July has a weaker last several days of seasonality the last 25 years. Dow has shown the most weakness compared to the other indexes. All in all, with a lot of catalysts this week and a market at fresh highs, seasonality doesn’t really favor piling into longs up here. The first week of August is also quite mixed but a slightly bearish start to the month is what history shows. Remember these are just tendencies and I always let price action confirm any trade setups.

2021-07-25_18-35-11.png

Inside week setups: Lots of earnings reports could move related stocks in similar industries and with the large reversals last week, there are very few inside week candles.

Bullish inside weeks: V, CNP, TEAM

Bearish inside weeks: FSLY, BABA, TDOC

Bull Put Spread Trade of the Week:

Zoom (ZM)

Sell the August 350/340 put spread for 3.60 or better. Earnings not due out til end of August after Aug Opex.

ZM has been pulling back to its 21 week EMA after a strong rally up to 400 during June. Near a spot of support around the 50 day MA and held 350 the last week. A good spot to sell a put spread and expect it to stay above 350 into August and perhaps take another shot higher towards 400.

Individual Stock Scans of note:

Weekly inside candles: BABA, V, TEAM, TDOC, EXAS, CAG, CNP, CTXS, GME, FSLY, EDIT

8/21 EMA Daily Bull Cross: GS, AMAT, SNAP, DE, LRCX, CSX, BSX, WDAY, KLAC, PINS, CNC, EA, DHI, YNDX, MDB, TSCO, FFIV, FIVE, AA, GOOS

8/21 EMA Daily Bear Cross: TSLA, NFLX, JD, ANTM, NTES, EDIT

Stocks compressing in TTM Squeezes within 10% of 52 week highs: WMT, VZ, AVGO, WFC, TXN, BMY, LOW, AXP, RTX, GS, MMM, VALE, CVS, LMT, SPGI, MO, GILD, TJX, FDX, ITW, COF, TEAM, CRWD, EMR, MTCH, CNC, EA, DFS, AFL, DDOG, SWK, SWKS, YNDX, URI, KMX, TSCO, AKAM, CAH, CNP, CBOE, DBX, NRG, DKS, JNPR, YETI, THC

55 day Highs with strong closes: MSFT, GOOGL, MA, PYPL, NKE, LLY, PFE, CSCO, PEP, ABT, TMO, ABBV, DHR, SHOP, ACN, COST, MDT, BMY, SBUX, MRNA, AMT, TGT, EL, NOW, ZTS, MDLZ, MMC, ABB, BDX, ICE, EW, ROKU, BSX, ETN, WM, DASH, DG, JCI, EBAY, TT, LHX, A, CARR, APH, OTIS, RSG, NET, FAST, INVH, EXPD, LB, BILL, DRE, ROL, HOLX, DT, NUAN, UDR, CHGG, PFPT, CUBE, VRT, DKS, G, IAA, BJ, MGP, MIC

Weekly Stock Market Update 7/19

Last week the SPX ended options ex week as expected with weakness starting to come in and confirm the weak breadth and bearish internals that have been building for over a week now. Closing the week near the lows opens up the door to retest that 4300 level which may produce a small bounce before further selling going into the seasonally weaker end of July time period. Lots of signals pointing to caution for now and even short trades have been working well. This week is also the start of more earnings reports hitting the market with some bigger tech names coming later in week and next week. Watching open gaps and VPOCs below the market will be key as there is quite a few below the market which can act as magnets the market likes to test and fill. Overall SPY likely testing the 21 ema early this week near 430 and that should be a big line in sand level for potential more downside or short term buyers to support for a bounce. VIX stayed strong friday which was a clue that volatility is getting bid and could likely get that pop into the low 20s which may be a level to cover some shorts or sell some premium into. The 50% retrace of the recent rally comes in at 426.31 as shown below and would be a first level to target support. RSI (5) has also seen bearish divergence recently pointing lower.

Short term ES_F futures chart showing recent untested VPOC’s below the market. When these stack up to more than a handful as shown it becomes a magnet for the market to test on the downside. The nearest ones to watch are 4305, 4270.25, 4256.75, 4238.5, and much lower eventually can see the 4094 VPOC but thats still a way’s out.

3 PEAKS MARKET SIGNALS OVERVIEW:

TREND- SPX Short term trend of the 8/13/21 EMA’s = Strong bullish trend

Long term trend of the 21/55/89 EMA’s = Strong bullish and EMA’s stacked positive.


CONDITION/BREADTH- SPX Momentum is weakening even though the trend is bullish, clearly losing momentum the past week which can lead to short term downtrend eventually.

Breadth continued weakness last week. Cumulative Advance/Decline line broke to new recent lows as shown below and should be a red flag into end of July. NYSI Summation index pushed to new lows Friday. New 52 week highs have been lagging with SPX near highs. NYSE had 109 new highs on Friday and this is below the 20 day average of 157 which itself is declining.

SENTIMENT- AAII Investor sentiment survey Bullish sentiment ticked down to 36.2% Bulls from 40.2% last week. Bears up to 26.8% from 24.5% last week. Bulls/bears ratio at 1.35.

Sentiment data is looked at as contrarian and Bullish signals occur when Bulls drop under 35%, or when Bears rise above 50%. Bearish signals occur when Bulls exceed 55% or if Bears drop under 20%.

S&P SPY Sector Glance:

6 of 11 SPY sectors are in strong bullish trends, XLK, XLV, XLY, XLC, XLRE, XLP. Utilities had a strong week leading the upside at +2.6% and that usually only happens in risk off markets. Energy got pummeled declining nearly -8% for the week.

2021-07-18_15-32-23.png
Using long term trend of 5 EMAs to determine trend. When the  8, 21, 34, 55, 89 day are all stacked bullish we have a bull trend.

Using long term trend of 5 EMAs to determine trend. When the 8, 21, 34, 55, 89 day are all stacked bullish we have a bull trend.

SEASONALITY ODDS:

The week after July OPEX has tendency for volatile swings. Dow is up 13 of last 18 years overall but Nasdaq and Russell have seen weaker performance. The Russell IWM is down 25 of last 40 years the week after July OPEX. If there is likely to be a bounce this week it would seem probable early in the week before Wednesday’s historical bearish days start to take over. Wednesday after OPEX week has been up on the SPX only 19% of years going back to 2000.

2021-07-18_15-42-08.png

Inside week setups: Lots of earnings reports starting to get near on key stocks but a few inside week candles of note that could be worth playing the breaks of upside and/or downside of the candle if a weaker market.

Bullish inside weeks: UPS, CMCSA, EW

Bearish inside weeks: PDD, BIDU, AAL

2021-07-18_16-06-48.png

Bull Put Spread Trade of the Week:

Square (SQ)

Sell the August 230/220 put spread for 3.50 or better. Earnings due out 8/5.

SQ has been basing nicely at 21 week EMA which is also near YTD VWAP. Held up green on Friday in a weak tape and although can see some downside if growth names get sold, it could be an even better put spread sale opportunity down under 230 if a few more days of selling materialize.

Individual Stock Scans of note:

Weekly inside candles: CMCSA, T, UPS, UNP, AXP, PDD, SCHW, IBM, SQ, CI, PNC, CME, CSX, EW, NSC, BIDU, ADI, GD, MET, BAX, AFL, YUM, MCK, BBY, KSU, EXPE, KEY, TTM, WB, AAL, SKX

8/21 EMA Daily Bull Cross: SO, D, BNTX, VRTX, KR

8/21 EMA Daily Bear Cross: CRM, TXN, AZN, SE, ZM, EWJ, SPOT, NTR, PTON, OKE, XLI, APO, CLR, SKX, COG, AEO, URBN, OSTK, TAN

Stocks compressing in TTM Squeezes within 10% of 52 week highs: VZ, CSCO, AVGO, SHOP, PM, BMY, RTX, VALE, LMT, GSK, USB, FDX, CSX, SO, NOC, DOCU, GD, EPD, MNST, MTCH, CNC, EA, PPG, AFL, YUM, NTR, NET, ZS, MCK, SYF, WORK, HRL, YNDX, IP, HIG, AKAM, CAH, CNP, JNPR, DKS, JBL, YETI, THC

55 day Highs with strong closes: GOOG, V, PG, ADBE, KO, PEP, ABBV, TMO, DHR, TMUS, COST, NEE, AMT, MRNA, MDLZ, CCI, CL, WM, DG, KMB, TT, LHX, WELL, RSG, OTIS, EQR, ES, WORK, INVH, VTR, AVTR, PEAK, DRE, NUAN, UDR, LNT, AMH, PFPT, FR, STAG, CVA

Weekly Stock Market Update 7/12

The SPX closed Friday of the shortened week at new highs after the snapback from Thursday’s liquidation break rebounded nicely. We got the one day sharp pullback that was a risk this week, and it sent the VIX up into the 21 level where it fizzled and turned out to be a good volatility spike to sell premium on. Friday’s bounce was strong from the opening bell as Breadth readings expanded fast and the TICK showed a trending day up from the start as I alerted on twitter. The coming week is July options expiration so volatility has a tendency to pick into and after expiration week. There is also a lot of Econ data out this week with CPI, Retail Sales, and Powell testifies midweek. Also the start of earnings season with banks reporting should be something to watch with bonds influencing financials each week lately. Overall, now Thursdays lows near the 21 EMA that were made at 4290 are a line in sand going into mid month and any crack below that would likely increase selling towards 4200 on the SPX. Holding above the 8 ema now at 4330 is a short term sign of possible momentum expanding to highs.

3 PEAKS MARKET SIGNALS OVERVIEW:

TREND- SPX Short term trend of the 8/13/21 EMA’s = Strong bullish trend

Long term trend of the 21/55/89 EMA’s = Strong bullish and EMA’s stacked positive.


CONDITION/BREADTH- SPX Momentum is positive and pushing back higher since 6/24.

Breadth still lagging overall. Cumulative Advance/Decline line still slightly below new highs. NYSI Summation index pushed to the May lows Friday as the SPX hit new highs. This continues to be a yellow flag showing the narrow leadership in this market. All of these internal signals weakening might take a few weeks to play out but are warning of sharp downside risk.

New 52 week highs have been lagging with SPX near highs. NYSE had 152 new highs on Friday and this is below the 20 day average of 176. At new SPX highs would expect higher numbers.

SENTIMENT- AAII Investor sentiment survey Bullish sentiment ticked down quick to 40.2% Bulls from 48.7.% last week. Bears up to 24.5% from 22.2% last week. Bulls/bears ratio at 1.64.

Sentiment data is looked at as contrarian and Bullish signals occur when Bulls drop under 35%, or when Bears rise above 50%. Bearish signals occur when Bulls exceed 55% or if Bears drop under 20%.

S&P SPY Sector Glance:

6 of 11 SPY sectors are in strong bullish trends, XLK, XLV, XLY, XLC, XLRE, XLI. Real estate had a strong week leading the upside at +2.7% but is the lowest weighting in the SPX. Energy the weakest last week -3.4%.

2021-07-11_13-59-35.png
2021-07-11_14-29-24.png

SEASONALITY ODDS:

This week is already July options expiration and seasonality for July tends to peak this week. Stronger to begin the week with Tues/Wed showing a strong bullish bias. 81% of years recently have been up Tuesday of expiration week. Seasonal weakness comes in the back half of the week, perhaps after the VIX expires Wednesday at the open it could be a time for a pullback to begin, especially looking ahead to next week where historically the market softens up into end of July.

2021-07-11_14-31-58.png

Bullish Inside Week Setup: Coinbase (COIN)

COIN had a strong week and closed near the highs above its 50 day MA for the first time. Somewhat correlated to Bitcoin which has stabilized and seeing a basing pattern form. COIN is coming out of a downtrend post IPO but firmly above the 8/21 ema since it had a bull cross and has seen lots of buyers support it in the 230-240 range. A move through 257 high last week can target 270-275. Stop level could be 230.

Trade to consider: Long August 260/280 call spread at 6.75

Bull Put Spread Trade of the Week:

Tesla (TSLA)

Sell the July 23rd 650/640 put spread for 3.80 or better. Earnings due out the week after so options before that date will decay faster. Also potential great trade with less gamma risk in the August 650/640 put spread for 4.40 credit.

TSLA has been basing nicely at 21 week EMA. Can likely see a pop back into the 700 level before earnings and above that could gain momentum towards 730. The ideal spot to sell put spreads was last week on that gap down but if that turns out to be the swing low off an oversold RSI 5 day then upper bollinger band at 705 seems like a target.

Individual Stock Scans of note:

Weekly inside candles: COIN, MS, DD, NRG, SWKS, EBAY, PM, MA, BSX, WMT, EA, CAG, ED, SO, MRK, AVXL,

8/21 EMA Daily Bull Cross: JWN, AA, TECK, UA, FL, KMI, PCG, XLI, MMM, EPD, MCD, CSCO, CNP, CL,

Stocks compressing in TTM Squeezes within 10% of 52 week highs: MA, ASML, CSCO, PFE, AVGO, TMUS, PM, BMY, SE, GSK, MDLZ, COP, FDX, COF, BX, VMW, BSX, GD, ALGN, EOG, MNST, PXD, DFS, IFF, VFC, MCK, ANET, SYF, WORK, OKE, LNG, AKAM, CAH, CLF, MRO, CIEN, JBL, CPRI, YETI, SKX, THC, SIG, SWN, CSTM, CYH,

55 day Highs with strong closes: AAPL, PYPL, AVGO, COST, SBUX, NOW, ZTS, CCI, ADP, MMC, ABB, ETN, LULU, TROW, LHX, A, TT, APH, PAYX, WELL, CHWY, EQR, OKE, INVH, DRE, UDR, AMH, NRG, CUBE, ARCC, FR, NSA,

Weekly Stock Market Update 7/5

The market closed the week before the 4th of July strong and at new highs. With the SPX hitting 4350 and really surpassing its expected move the last week its quite extended from its 21 day EMA and ripe for a pullback or liquidation break lower at any time. The last two weeks have pretty much gone vertical instead of the 2 steps up and 1 step back normal price action tends to produce. You can see there was a bit of a chase into end of quarter evidenced by the mega cap tech names like AAPL, AMZN, GOOGL, FB, NVDA all exploding higher even while breadth overall was not very strong. The leadership of the market is narrowing and sentiment is rising back into frothy levels. Its a good time for caution and I will be looking to be nimble with fewer positions into the shortened holiday week as there are several signs that a retracement can start into mid July.

3 PEAKS MARKET SIGNALS OVERVIEW:

TREND- SPX Short term trend of the 8/13/21 EMA’s = Strong bullish trend

Long term trend of the 21/55/89 EMA’s = Strong bullish and EMA’s stacked positive.


CONDITION/BREADTH- SPX Momentum is positive and pushing back higher.

Breadth still lagging overall. Cumulative Advance/Decline line struggling to make new highs. NYSI Summation index is in bearish short term mode pointing down.

New 52 week highs have been lagging with SPX near highs. NYSE had 203 new highs on Friday and this is slightly below the 20 day average of 218. Generally at new SPX highs would expect higher numbers.

SENTIMENT- AAII Investor sentiment survey Bullish sentiment ticked up to 48.7% Bulls from 40.4.% last week. Bears down to 22.2% from 23.2% last week. Bulls/bears ratio at 2.20.

Sentiment data is looked at as contrarian and Bullish signals occur when Bulls drop under 35%, or when Bears rise above 50%. Bearish signals occur when Bulls exceed 55% or if Bears drop under 20%.

S&P SPY Sector Glance:

6 of 11 SPY sectors are in strong bullish trends, XLE, XLV, XLC, XLK, XLRE, XLY. Technology had a strong week leading the upside at +3.1% and several other sectors contributed for a broad based rally. Energy the weakest last week -1.2%

SEASONALITY ODDS:

July 1st is historically strong and it proved to be as the market sailed higher to start the month of July. The week after 4th of July has tended to be bullish bias but while the odds are stronger close to 60% of years up, we are extended and this could be more of a sideways week. Next week is already July options expiration so looking ahead is somewhat stronger to begin the week with Tues/Wed showing a strong bullish bias before seasonal weakness comes in the back half of expiration week.

2021-07-04_18-02-48.png

Bullish Inside Week Setup: Snapchat (SNAP)

SNAP has been building energy above 60 the past month and recently cleared YTD VWAP and is now bull flagging inside of a larger weekly bull flag. Last week saw an inside week candle with a quiet range of just 3.50 when its usual weekly ATR is over 6.0. A move back over 69.25 likely triggers a move to the old highs near 73 for a quick trade before earnings is released the week of July 23rd.

Trade to consider: Long July 69/74 call spread at around 1.50 for a quick trade. Also the August 70/80 call spread an interesting idea to hold longer for eventual move to 80 weekly flag target.

Bull Put Spread Trade of the Week:

Disney (DIS)

Sell the August 180/170 put spread for 4.40 credit.

Max risk of 5.60 per spread with breakeven at expiration at 175.60.

61% probability of making at least 50% of the credit received.

Disney has been basing nicely at YTD VPOC and the 21 week EMA. Can likely see a pop back into the 180s especially if the market overall rotates to more value oriented names that have yet to run recently.

Individual Stock Scans of note:

Weekly inside candles- AMZN, UNH, PYPL, DIS, XOM, LLY, WFC, SHOP, MCD, C, AXP, CAT, VALE, SNAP, GSK, USB, FDX, COF, BX, FCX, MET, EOG, MNST, SLB, MTCH, AIG, MPC, AFL, SU, GLW, NET, VLO, W, NUE, SYF, TSN, HRL, DLTR, DISH, HIG, MGM, HAL, KEY, LBTYK, PENN, UAA, KSS, NTNX, AEO, DDD, FUBO, URBN

8/21 EMA Daily Bull Cross- AA, UNP, DHI, WMT, PG, CAH, UNH, PFE, JNJ, CSCO, DIS, EA

Stocks compressing in TTM Squeezes within 10% of 52 week highs: V, JNJ, UNH, MA, CMCSA, LLY, PEP, ABBV, AVGO, TMUS, MDT, UNP, SCHW, SBUX, AMT, LRCX, COP, FDX, PBR, CME, HCA, EOG, HSY, MCK, HES, WORK, OKE, MGM, AKAM, LBTYA, LBTYK, MRO, CPRI, YETI, THC, SWN, CYH

Weekly Stock Market Update 6/28

The market had an impressive snapback rally this week after the expiration related selling last Friday held the 50 day MA once again creating a higher low at 4165. Although internals and breadth were not exactly super strong on the move to new highs in SPX. This can continue of course but its a sign of weakening under the hood and likely a yellow flag into the summer months that could create downside risk. The amount of stocks in the SPX above the 50 day MA are also under 50% which is historically a sign of a rally running out of fuel. Just good data points to carry forward and realize things can turn quick in the coming weeks or months. Going into the last week of June and the 2nd quarter ending on Wednesday the 30th its a good time to expect some back and forth or potential pullback after 5 days straight up. The Nasdaq has led the upside lately and will be extended coming into end of quarter so profit taking wouldn’t be unusual to end June.

3 PEAKS MARKET SIGNALS OVERVIEW:

TREND- SPX Short term trend of the 8/13/21 EMA’s = Strong bullish trend

Long term trend of the 21/55/89 EMA’s = Strong bullish and EMA’s stacked positive.


CONDITION/BREADTH- SPX Momentum pushing back higher but some negative divergences showing on RSI and MACD.

Breadth recovered a bit but overall not as strong as you would expect as Cumulative Advance/Decline Breadth struggling to make new highs. NYSI Summation index is in bearish short term mode pointing down.

New 52 week highs have been lagging with SPX near highs and last week only improved slightly. NYSE had 213 new highs on Friday.

SENTIMENT- AAII Investor sentiment survey Bullish sentiment ticked down to 40.4% Bulls from 41.1.% last week. Bears down to 23.3% from 26.2% last week. Bulls/bears ratio at 1.73.

Sentiment data is looked at as contrarian and Bullish signals occur when Bulls drop under 35%, or when Bears rise above 50%. Bearish signals occur when Bulls exceed 55% or if Bears drop under 20%.

S&P SPY Sector Glance:

6 of 11 SPY sectors are still in strong bullish trends, XLE, XLV, XLC, XLK, XLRE, XLY. Financials had a strong recovery week +4.8% and Tech overall has led continuing the upside. Consumer Discretionary had a strong week +3.3% mostly thanks to TSLA and AMZN, the top two weightings.

SEASONALITY ODDS:

Going into the end of June its generally a bullish tendency, especially in the Nasdaq. July 1st is historically strong and the day before the 4th of July has tended to be weaker. Its important to know these seasonal odds are just tendencies and don’t equal setups for me. When a setup matches up with a seasonal tendency it makes it that much more valuable. With stocks extended since last week was stronger than its seasonal odds it could make for choppier action to end the month. The following week is a 4 day week with the July 4th holiday closed on Monday. The first week of July has shown bullish bias.

Bullish Inside Week Setup: Starbucks (SBUX)

SBUX has a daily squeeze ready to fire higher out of the inside week candle last week. The stock pulled back off April highs and found support above YTD VWAP right into the 21 week EMA. Triggering a move up through 113.25 can pop up to 115.50 first target and perhaps 117 on a strong move.

Trade to consider: Long August 115 calls around 3.00

Individual Stock Scans of note:

Weekly inside candles- JPM, JNJ, WMT, BAC, PG, KO, VZ, INTC, CSCO, ORCL, PFE, CVX, T, TMUS, TXN, MCD, MS, HON, C, UNP, AMGN, SCHW, SBUX, RTX, IBM, GS, CAT, MMM, CVS, ANTM, BP, MDLZ, MO, GM, USB, GILD, ADP, CI, NIO, COF, ITW, BDX, HCA, NSC, VMW, STLA, NOC, ETN, EMR, BNTX, FCX, MET, DOW, SLB, MAR, WBA, BK, CNC, AIG, BAX, MPC, DD, MCHP, ALXN, PSX, SYY, CTSH, GOLD, SU, AFL, PANW, HPQ, CMI, YUM, NTR, GLW, ADM, LYB, XPEV, VLO, WMB, MT, LEN, MCK, SYF, NUE, DAL, BBY, TSN, WY, OKE, EXPE, ABC, IP, RCL, HIG, LNG, CZR, HAL, DKNG, KEY, TTWO, AKAM, NTAP, UAL, ON, WYNN, AAL, NVAX, TECK, TPR, MOS, NCLH, CREE, CF, CLF, JNPR, CIEN, JBL, APA, YETI, THC, OLN, HOG, AA, SFIX, X, TRIP, CC, HLF, HFC, SEAS, SAGE, CSIQ, PLAY, NNOX

8/21 EMA Daily Bull Cross- BABA, NKE, UBER, GILD, ADP, BIDU, NXPI, EEM, KMB, HSY, VFC, KMX, DKNG, GPS, KSS, CPRI, HLF, FXI, CSIQ

Stocks compressing in TTM Squeezes within 10% of 52 week highs: JNJ, PG, CMCSA, CVX, PEP, AVGO, TXN, MCD, MDT, SCHW, SBUX, AMAT, LRCX, MDLZ, ADP, ADI, NOC, JCI, HSY, MCK, HES, WORK, GPS, JBL, CPRI, THC, URBN, SWN, YELP, CYH,

Weekly Stock Market Update 6/21

SPX started off last week making a new high, then turnaround Tuesday sellers came in ahead of FOMC day and sold things lower the rest of the week, closing quite red by Friday afternoon. We have been looking for weakness into the end of June starting near that triple witching options expiration day and it looks on track. Going into this week I am playing things cautious with new positions and likely focusing on shorter time frame trades and smaller size. Breadth showed red flags last week when most stocks were actually declining throughout the week, just a select few big cap tech names carried the Nasdaq higher thanks to the rally in bonds, pushing yields lower. With internals getting worse under the hood, its hard to see the growth tech names not eventually joining in the selling if bounces in the SPX get sold into the last two weeks of June and Q2. Seasonality does not favor the bulls for now and with the markets failing to stay above the 4250 level, it brings the potential to reverse all the June gains back down to retest the May lows near 405 on SPY.

Closing below the 50 day MA opens the door to that 412 level which is May value area low. If the SPY can’t bounce much from there its a sign of weakness and eventually 395-400 retest is coming. That zone represents a confluence of support being the YTD VWAP at 398, and original breakout level from early April, an open gap still unfilled and March VPOC untested.

3 PEAKS MARKET SIGNALS OVERVIEW:

TREND- SPX Short term trend of the 8/13/21 EMA’s = Strong bullish trend, but this should turn to weak trend in a day or two as the 8/21 ema crosses down.

Long term trend of the 21/55/89 EMA’s strong bullish and EMA’s stacked positive.

CONDITION/BREADTH- SPX Momentum now pointing down after the reversal from new highs.

Breadth quickly weakened last week as Cumulative Advance/Decline Breadth made new highs and reversed midweek. NYSI Summation index is in bearish short term mode crossing down.

New 52 week highs have been lagging with SPX near highs and last week showed the issues more so. Just 14 new highs in the S&P 500 on Friday.

SENTIMENT- AAII Investor sentiment survey Bullish sentiment ticked up to 41.1% Bulls from 40.2% last week. Bears ticked up to 26.2% from 20.7% last week. Bulls/bears ratio at 1.57.

Sentiment data is looked at as contrarian and Bullish signals occur when Bulls drop under 35%, or when Bears rise above 50%. Bearish signals occur when Bulls exceed 55% or if Bears drop under 20%.

S&P SPY Sector Glance:

Only 5 of 11 SPY sectors are still in strong bullish trends, XLE, XLV, XLC, XLK, XLRE. The Financials XLF got clobbered after the FOMC statement and will be a key sector to watch from here as they are leading the SPX lower.

SEASONALITY ODDS:

Going into the week after expiration I mentioned its likely a bearish week and the Fed meeting was a good catalyst for that potential downside. This week is decidedly bearish odds with the week after providing potential stronger bullish odds ahead of the 4th of July holiday weekend coming quickly. Getting a few more days of selling could provide a short term low to trade against into the following week.

Bullish inside week setup: SPCE Virgin Galactic

With the market weak and likely getting weaker, being selective with bullish setups is key, a stock like SPCE usually does its own thing and is set up here for potential. Inside week last week and held up well. Trigger above 37.75 can target a move to 41 and that open gap. Stops under 34. Lots of call skew in the IV so spreads make sense.

Trade to consider: Long July 37/42 call spread at 1.70

Individual Stock Scans of note:

Weekly inside candles- PFE, LLY, ABBV, TMUS, BMY, AMGN, BDX, BIIB, BAX, IFF, YNDX, XLV, GME, CPB, DBX, WB, IBB, CLF, SPCE, JNK, FSLR, FSLY, SFIX, FUBO, RSX

8/21 EMA Daily Bull Cross- WDAY, OKTA, COUP, CDAY, CHGG, VIR, IONS, HAE, SYKE, MCRB, CAI, PRAX

Stocks compressing in TTM Squeezes within 10% of 52 week highs: MA, CMCSA, PEP, AVGO, ACN, MCD, TXN, COST, CHTR, SBUX, LMT, LRCX, MDLZ, ADP, CME, BSX, NOC, GD, MNST, PANW, HSY, KKR, XLY, APO, XLU

Weekly Stock Market Update 6/14

The SPX continues to grind up slowly towards new highs into a big June triple witching options expiration week. Last week was mostly quiet with eventual strength closing the week at highs, especially in technology as the QQQ Nasdaq etf led the upside and now very close to taking out the late April highs above 343. I have been looking for the ES_F futures to clear this 4225 zone and get up to 4300 area this month but even with the break higher Thursday last week, it wasn’t as powerful of a push as one might have expected. Maybe options expiration week gives it the added boost but after this week, the risk of downside reversals start to increase, especially from new exhaustion highs. For now, internals and breadth are confirming the push higher but notice how the key moving averages I use (8,21,34,50) are converging higher and closer together. It really has been a stock pickers market as the major indexes have mostly been in choppy tight ranges since April. SPX has overlapping value areas in April and May between 4100-4200, now June is trying to build value higher as it should but if cannot stay above 4200, its a yellow flag going into end of month for me.

3 PEAKS MARKET SIGNALS OVERVIEW:

TREND- SPX Short term trend of the 8/13/21 EMA’s = Strong bullish trend

Long term trend of the 21/55/89 EMA’s strong bullish and EMA’s stacked positive.

CONDITION/BREADTH- SPX Momentum now pointing up and the Squeeze confirmed breakout mode but slight fallback on the squeeze momentum histogram to dark blue shows lack of strong thrust higher late last week. RSI 62 still in neutral area and not overbought, Bollinger %B back to 88 and closer to being overbought soon.

Breadth is strong as Cumulative Advance/Decline Breadth made new highs and NYSI Summation index is in bullish mode. This is very important as its showing under the hood of the market advancers are outpacing decliners before the index fully breaks out.

New 52 week highs are somewhat lackluster here and would prefer stronger readings. With the SPX closing the week at new highs, just 34 stocks in the S&P 500 hit new 52 wk highs Friday.

SENTIMENT- AAII Investor sentiment survey Bullish sentiment ticked down to 40.2% Bulls from last week at 44.1% Bulls. Bears ticked up to 20.7% from last week at 19.8%. Bulls/bears ratio at 1.94.

Sentiment data is looked at as contrarian and Bullish signals occur when Bulls drop under 35%, or when Bears rise above 50%. Bearish signals occur when Bulls exceed 55% or if Bears drop under 20%.

NYSE 52 week highs lower than they were in April. Slight divergence forming. 20 day Average at 249

S&P SPY Sector Glance:

All of the sectors in the SPX are in strong bullish trends as shown below. The sectors that improved this past week were XLY Consumer Discretionary, XLV Healthcare and XLU Utilities. Tech XLK sector also strong this past week and with its higher weighting in SPX helped things. XLB Materials is one to watch this week as its forming a squeeze consolidation near its 21 ema.

SEASONALITY ODDS:

Seasonality for June options expiration week has tended to be strong into midweek as shown, Tuesday has been the strongest day of the week overall the last 21 years up 67% of years. Going into the week after expiration is a different story and one of the more bearish seasonality weeks of the year. It could be a great time to take things off the table going into this historically weaker end of June period.

Bullish inside week setup: TXN Texas Instruments

Semi stocks have been in a bullish consolidating pattern as SMH etf shows. Quite a few leaders in the space have already broken out to new highs like NVDA. Last week TXN had an inside week candle and closed near the highs. A break above 190 trigger likely leads to 195 quick, or even 200 in a strong market.

Trade to consider: Long July 190 calls at 4.00 or better. Target 195. Stop under 186 or trail up after the breakout.

Individual Stock Scans of note:

Weekly inside candles- TSLA, CMCSA, KO, ABT, TXN, COST, QCOM, SBUX, LRCX, CL, BSX, WDAY, SLB, JCI, MAR, ROKU, KMB, GLD, PXD, MTCH, CTSH, GLW, YUM, NUE, DAL, OXY, HRL, AMC, DLTR, WPM, HAL, FUTU, ETSY, SPLK, XLY, SLV, APO, TPR, GPS, CGC, IAU, XLP, KSS, CPRI, ICLN, AEO, SMH, HFC, FEYE, URBN, DDD, BBBY, ANF, GRWG, XME

8/21 EMA Daily Bull Cross- INTC, BHP, NOW, DG, CDNS, TDOC, HZNP, XLY, GDDY, XLU, INSM, RIOT, CSIQ, MX

Stocks compressing in TTM Squeezes within 10% of 52 week highs: WMT, MA, BAC, PEP, WFC, ACN, MCD, COST, PM, UNP, SBUX, MMM, MO, PNC, CL, SO, BSX, MET, GD, KHC, DOW, DD, KMI, AFL, GLW, YUM, KKR, EXPE, IP, OKE, HIG, WDC, STX, HPE, LB, APO, MOS, CPRI, HOG, SWN

Weekly Stock Market Update 6/7

The SPX had a quiet pullback early in the week which caught support near 4175 at the 21 day ema and rebounded strong Friday after the May jobs report. As shown below on the left, the daily chart of the ES futures fired off a squeeze buy signal 3 days ago with momentum pushing up. This looks highly likely to resolve higher next few weeks into that 4295 Fib target or higher. The Nasdaq has more room to run higher it feels like since its been held down by yields, but with interest rates falling sharp on friday there is alot of relative strength showing up in Tech related growth stocks again. The weekly chart on the right shows a clear trend up, and until price closes below the 10 week moving average (yellow dashed line) this can continue to drift up. As we head into mid June and triple witching options expiration on 6/18 with a key FOMC meeting that week, it could start to create a good selling opportunity into that catalyst before a potential pullback into end of June when seasonally things tend to get weak.


3 PEAKS MARKET SIGNALS OVERVIEW:

TREND- Short term trend of the 8/13/21 EMA’s = Strong bullish trend

Long term trend of the 21/55/89 EMA’s strong bullish and EMA’s stacked positive.

CONDITION/BREADTH- Momentum now pointing up and the Squeeze confirmed breakout mode, RSI 60 back into neutral area and not overbought, Bollinger %B back to 82 and closer to being overbought soon.

Breadth is strong as Cumulative Advance/Decline Breadth made new highs and NYSI Summation index is in bullish mode.

New Highs increased last week which supports the bullish trend in SPX.

SENTIMENT- AAII Investor sentiment survey Bullish sentiment ticked up quite a bit this week to 44.1% Bulls from last week at 36.4% Bulls. Bears ticked down to 19.8%. Bulls/bears ratio at 2.23.

Sentiment data is looked at as contrarian and Bullish signals occur when Bulls drop under 35%, or when Bears rise above 50%.

S&P SPY Sector Glance:

Most of the sectors in the SPX are in strong bullish trends as shown below. The only ones slightly below their 8/21 EMA’s are XLY Consumer Discretionary, XLV Healthcare and XLU Utilities but one strong day can change that. We know that Tech has a large weighting in the SPX so with the strong candle Friday this could lead to more upside if XLK continues up.

SEASONALITY ODDS:

Seasonality the week before June options expiration has tended to see weakness by midweek as shown by the sub 40% of years that have gained. Dow has outperformed the S&P and Nasdaq this week over the years. This may provide a dip buy opportunity which then leads to potential strong upside edge during the following week which is options expiration.

Bullish inside week setup: FB Facebook

FB has been riding its 21 EMA higher since its big weekly breakout in March, still seems poised to hit that upper fib target 342 and perhaps 350 round number. This week had a quiet inside candle consolidating gains. This is a momentum setup buying new highs above 332 as the break of the inside bar can lead to new highs for a quick 10-15 pts. Needs to stay above 325 for setup to be valid.

Option trade to consider, long the June 330/340 call spread at 3.50 or better. Going out to July is fine too but will move slower

Individual Stock Scans of note:

Weekly inside candles- FB, CRM, HSBC, GSK, MO, VRTX, KHC, DG, COIN, WBA, DASH, LQD, MRVL, HPQ, PTON, BBY, VIAC, WORK, ZS, YNDX, DLTR, TDOC, CLX, MGM, DKNG, CAH, PENN, UAA, BYND, DKS, SPCE, FSLY, JWN, SPWR, URBN, XBI, ANF, MARA, EWH, LABU, LABD, ASHR, ARKK

8/21 EMA Daily Bull Cross- BHP, TRMB, PLBY, WAL, CREE, PCAR, PCT, LULU, APPS, DUK, BIIB, NVAX, WBA, HFC, MU, DOCU

Stocks compressing in TTM Squeezes within 10% of 52 week highs: AMZN, BAC, MA, CSCO, NKE, ACN, MCD, COST, CAT, IBM, HSBC, MMM, LMT, MO, CI, ADP, FDX, CL, FCX, NOC, BSX, ETN, MET, GD, KHC, DOW, BK, EA, ADM, MCK, ED, IP, EXPE, OKE, HIG, KEY, HYG, HPE, CAG, LB, NTAP, CPB, MOS, APO, CF, ADS, EWU, KRE, FAS, AMLP

Weekly Stock Market Update 6/1

SPX closed out the month of May on a high note after a volatile start and mid-month dip of about 3%, ending the month slightly in the green by +0.5%. After the VIX popped its head into the mid 20s a few times it ended the month near lows sub 17 and showed again why its been very good to sell premium into these IV jumps as the SPX continues to hold the 50 day MA as support all year. Financials XLF led the month with a +5.7% gain, followed by Materials +4.6% and Energy +4.2%. Tech and Consumer Discretionary lagged overall down about -3% each. Some positive breadth continued this past week which helped the market drift higher into a quiet holiday weekend and as June starts next week new money flows likely take the SPX to new highs above that 4240 level which isn’t far away. Cumulative AD breadth as shown below has already made new highs and this is a confirmation signal of strength under the hood of the markets. Sentiment is still not overly bullish as investors quickly got bearish on the recent dip.

SPX weekly chart riding the 8 week EMA higher for now

3 PEAKS MARKET SIGNALS OVERVIEW:

TREND- Short term trend of the 8/13/21 EMA’s = Strong bullish trend

Long term trend of the 21/55/89 EMA’s strong bullish and EMA’s stacked positive.

CONDITION/BREADTH- Momentum now pointing up and the squeeze indicator I use coiling up for move to new highs, RSI 57 back into neutral area and not overbought, Bollinger %B back to neutral at 73.

Breadth has improved in the last week. Cumulative Advance/Decline Breadth made new highs and NYSI Summation index has crossed positive.

New Highs are however lagging a bit lower from April levels but still outpacing New lows as they should.

SENTIMENT- Bullish sentiment still quite low at 36.4% Bulls in this weeks AAII Investor sentiment survey. It has stayed in this range for 3 weeks now even with stocks recovering strong back to near highs. Bears ticked up to 26.4%. Neutral readings have increased. Bulls/bears ratio at 1.38.

Sentiment data is looked at as contrarian and Bullish signals occur when Bulls drop under 35%, or when Bears rise above 50%.

Seasonality for first week of June is bullish overall as new month tends to see new flows, with Tuesday and Wed the strongest after the holiday weekend. S&P 500 has been up 67% of years the first trading day of June.

Individual Stock Scans of note:

Weekly inside candles- AMZN, JNJ, WMT, UNH, HD, CMCSA, T, CVX, WFC, UPS, ACN, COST, UNP, AZN, LOW, CAT, IBM, MMM, JD, DE, BP, NTES, CSX, COP, BDX, BIDU, SO, FCX, NEM, ETN, EMR, DOW, COIN, BNTX, ROST, EBAY, SYY, ALXN, CTSH, LYB, ADM, GLW, LUV, DFS, SU, MT, VLO, WMB, NUE, TSN, KR, HRL, HES, OXY, HIG, WDC, DISH, KEY, STX, ETSY, HAL, LB, XLV, DVN, GDX, SLV, VIPS, TPR, UAA, KSS, XLB, X, FL, XLE, XHB, ITB

8/21 EMA Daily Bull Cross- TSM, QCOM, SBUX, AMD, ETN, LUV, XLNX, OXY, LYFT, PHM, IBB, CPRI, AA, EWY, AEO, TNA, MJ

Stocks compressing in TTM Squeezes within 10% of 52 week highs: JNJ, WMT, UNH, BAC, KO, ORCL, NKE, ABT, PEP, ABBV, WFC, UPS, MCD, COST, PM, UNP, SCHW, HSBC, CAT, AXP, IBM, MMM, USB, BP, CI, FDX, ADP, COP, HCA, VMW, FCX, ETN, MET, EPD, BNTX, JCI, BK, WBA, EBAY, EA, MPC, AFL, LYB, ADM, PSX, LUV, DFS, YUM, SU, VLO, TSN, ED, EXPE, OKE, HIG, KEY, HPE, LB, CAG, LBTYA, WYNN, MOS, APO, TAP, MRO, FLEX, JNPR, CCJ, YETI, FL, NAV

Weekly Stock Market Update 5/10

The SPX finished the week strong after a squeeze higher into and after the Jobs report friday pushed stocks to close at all time highs. It was a sloppy week with alot more weakness in Nasdaq tech growth stocks and overall the QQQ Nasdaq closed red for the week so its been a stock picking market where the best trends exist in specific sectors outside of growth related names. The SPX has been coiling around 4175 for weeks now while it held the 21 ema as support last week so any early week continuation likely can push further and coincide with a gamma squeeze towards 4300. The expected move for the week implied by the options market is about 61 points on the SPX. That implies a range of 4167-4297. First support comes in at the 8 ema near 4193 and the 21 ema now at 4154. 50 day MA is 4033.

3 PEAKS MARKET SIGNALS OVERVIEW:

TREND- Strong bullish trend with EMA’s stacked positive.

CONDITION/BREADTH- Momentum slowing, RSI 66, Bollinger %B back over 100 showing a little overbought. New highs for Cumulative Breadth confirming rally.

SENTIMENT- Bullish but not overly complacent with 44.3% Bulls in this weeks AAII Investor sentiment survey. Up from 42.6% last week. Bears ticked down to 23.1%. Bulls/bears ratio at 1.92. Sentiment data is looked at as contrarian and Bullish signals occur when Bulls drop under 35%, or when Bears rise above 50%.

SPY sectors mostly all green strong bullish trends, only XLK Tech sector showing a weak bearish trend.

Advance Decline line increased this week and ended at new relative highs, confirming the new rally highs in SPX. Notice in past when this did not happen, the SPX was then at risk of a pullback but for now this market is strong.

New 52 week highs in the SPX hit 167 friday which looks like the highest number in last several years. Thats roughly 33% of the index hitting fresh yearly highs. Strong amount of holdings are participating in the move up which is positive.

Seasonality for 2nd week of May is a bit softer as it is the week prior to options expiration which comes next week. Looks like the seasonality has tended to show more weakness towards the end of the week, and at this point the SPX is likely due for a pullback by then if we begin the week green.

Seasonality for 2nd week of May is a bit softer as it is the week prior to options expiration which comes next week. Looks like the seasonality has tended to show more weakness towards the end of the week, and at this point the SPX is likely due for a pullback by then if we begin the week green.

Individual Stocks of note:

Weekly inside candles- AEO, ALXN, AMGN, AZN, BAX, BMY, BSX, CME, CNP, CSX, EBAY, FB, GLW, GME, GOOG, HIG, HSBC, IBM, OSTK, SBUX, SCHW, VFC, VRTX, WY

8/21 EMA Daily Bull Cross- APG, AU, CARG, NWSA, HFC, WW, RDS/B, BTI, RDS/A, CPB, SCHO, EEM, SQM, GM, VGSH, APH, WDC, SRPT, SCCO, EWY, TNA, AMAT, PG, NKE, QCOM, APTV, MCK, AMGN, CMI, QQQ

Stocks in TTM Squeezes within 10% of 52 week highs: AMAT, BBY, CAG, CAT, CME, CNP, DE, DIS, DLTR, EA, EMR, EPD, EXPE, FLEX, GE, GLW, GM, HIG, HPE, HYG, IEF, IWM, JBL, JNK, KSS, LB, LEN, LQD, LRCX, LUV, MAR, MCD, MGM, OKE, PEP, RVLV, SBUX, SSO, TBT, TSN, UNP

Weekly Market Update 5/3

The market had a quiet week and narrow range of price action even with all the news catalysts the SPX stayed within its option expected range for the week. There was some profit taking into month end after a big run in April but with such strong earnings reports from big cap tech names like AAPL, AMZN, MSFT, FB the price action faded and clearly the new highs were sold into. SPY closed the week just a touch above the 8 EMA but starting to see divergences build so a pullback to the up trending 21 EMA near 412 is possible. Below that the 50 Day MA comes in near 400 and the lower end of a volume pocket created by the gaps higher to start early April. Eventually these open gaps do get filled so something to watch if we slip under April value area. Expected moves for this week priced into the options for SPY are between 410.67 and 423.93 so roughly 6.60 points of expected range. The first trading day of the month is generally stronger with new money flows creating some upside but if that only lasts a day this week then some downside is more likely.

spy.png

3 PEAKS MARKET SIGNALS:

TREND - SPY Strong bullish trend and Stacked EMA’s on both the short term daily and longer term weekly charts. The 8/21 day moving averages are above the longer term 50/200 day MAs but the momentum has slowed lately with the squeeze indicator showing dark blue histogram bars. All SPY sectors are in bullish uptrends as shown below.

SECTORS.png


CONDITION/BREADTH - The SPY is extended and with momentum slowing, RSI showing some bearish divergence at recent highs so we can pullback at any time. NYSI Summation index is mixed but pointing up and above its 8 EMA. Cumulative AD breadth is making new highs with the SPY this past week but not the kind of thrust higher you would expect. New highs vs new lows differentials are still positive with the 10 and 30 day MA above zero since November. 86% of stocks in SPX are above their 50 day EMA while 96% are above their 200 day EMA. The chart below shows the Advance/Decline Lines and how the recent new highs in SPX have not seen much strength in the AD figures. Usually can see +400 readings on strong breadth readings, meaning over 400 stocks in the S&P 500 are advancing and that was absent in April.

AD line.png


SENTIMENT- AAII Investor sentiment survey for the week showed a sharp drop in bullish readings for AAII Bulls at 42.6%, down from 52.7%. Bearishness up ticked to 25.7% from 20.5% last week. AAII Bull/bears ratio at 1.66. Sentiment data is looked at as contrarian and Bullish signals occur when Bulls drop under 35%, or when Bears rise above 50%. CBOE total put/call ratio ticked up to 0.95 Friday but overall 50 day MA at 0.78 still shows complacency.


Seasonality Stats for first week of May start out bullish bias but tend to see some weakness by midweek.

seasonality.png

Individual Stocks of note:

Weekly inside candles- T, EFA, SLV, KO, MU, MO, UAL, BA, JNJ, MRVL, HAL, DIS, ORCL, XLV, TECK, NKE, NVDA, PM, DOW, ABT, LUV, CSX, EWU, BIDU, HD, ROKU, DIA, PENN, LEN, FUTU, EW, ADBE, AVGO, CGC, MAT, BYND, HCA, LRCX, OKTA, ACAD

8/21 EMA Weekly Bull Cross- VZ, AZN, CL, USFR, TIP, FLWS, BF/B, APLS, SNN, VRM, LDOS, TBIO, VEEV

Stocks in TTM Squeezes within 10% of 52 week highs: GE, C, CCL, CSCO, NCLH, FISV, CVX, HPE, DIS, KHC, NUE, CL, WMT, JNPR, MGM, PEP, DOW, MPC, LUV, TMUS, HIG, ADI, CAT, LVS, UNP, VOD, CAG, CTSH, LEN, OKE, MCD, EA, EMR, MMM, KSS, FLR, CAH, TGT, FL, MAR, BBY


Weekly Market Update 4/26

Price action last week was a bit two sided but overall closed largely unchanged for the week and at the higher end of the range. As often is the case in uptrends, the dips get bought. After Thursday’s selloff failed and saw strength into Friday with strong confirming internals I would expect some early continuation this week before big tech earnings and the FOMC decision take more of a driver seat mid to late in the week.

Earnings releases this week will be a big story and some of the larger liquid names reporting are: TSLA, GOOG, MSFT, AMD, SPOT, PINS, V, BA, SBUX, AAPL, FB, GOOG, AMZN, TWTR

Weekly chart of SPY with 10 and 34 simple MA’s showing in dashed lines, and the 21 week EMA in blue. Definitely getting extended above upper Bollinger band. When this happens on a weekly chart its a warning but would still need price to confirm any reversals.

I always try to focus on 3 aspects of the current market, one being Trend, two being Condition or Breadth, and third being the Sentiment of the market. I think those 3 things in that order have helped me maintain a focused approach to trading over the years that helps keep me on the right side of the market.

3 PEAKS MARKET SIGNALS:

TREND - Strong bullish trend and Stacked EMA’s on both the short term daily and longer term weekly charts.

CONDITION/BREADTH - The SPY is extended and seeing multiple weekly candles close above the upper bollinger band is a sign of strength but at same time with RSI above 70 we can pullback at any time. NYSI Summation index is mixed but pointing up. Cumulative AD breadth is making new highs with the SPY as of the close Friday. New highs vs new lows differentials are still positive with the 10 and 30 day MA above zero since November.

SENTIMENT- Investor sentiment is getting pretty stretched and feels frothy again at times lately. AAII Bulls at 52.68 last week (over 55 has been associated with market peaks). AAII Bears at -20.5 last week was one of the lowest levels of bears all year.

SPY sector ETFs showing clear strong bullish trends in most all sectors except the XLE Energy ETF showing a weak bearish trend.

Seasonality for the final week of April is a bit mixed overall with strong tendencies midweek into Thursday, then quite bearish for the final day of April over the last 21 years of data the SPX has been up just 33.3% of years.

Individual Stocks of note:

Weekly inside candles- AMD, TSLA, NVDA, BYND, TLT, TDOC, DOCU, GS, CMCSA, ADBE, CSCO, TMO, UPS, NEE, LOW, GILD, DASH, BDX, ABB, PGR, TRP, YUM, LYFT, ZEN, NVAX, MOS

8/21 EMA Bull Cross- AMD, IWM, X, NCLH, KEY, TIGR, SCHW, ICLN, BILI, IJR, EBSB, ASHR, NLSN, JPST, DDOG, ENPH, MTCH, REAL, NOVA, XLNX, CREE, ZI, U, CROX, CUK, IWN, CVNA, KC, URBN, AAXJ

Q1 2021 Market Recap and Look Ahead

Recap:

The first quarter of 2021 ended at the highs for the SPX, finishing up +5.4% even with all the drama surrounding interest rates and growth stocks. The SPX weekly chart below shows the 10 week moving average held as support most of the quarter with just one slip towards the 21 week EMA. As long as those levels continue to support the market on dips, it should make an attempt at that upper fibonacci extension level at 4136. The Nasdaq felt more of that pressure being exposed to interest rate changes yet the QQQ Nasdaq 100 finished the quarter +1.7% after being down as much as -5% at the lows before rebounding late March. However the real strength was in the small cap stocks and Dow Industrials. The IWM Russell 2000 index finished up +12.7% and the DIA Dow 30 up a solid +7.9%.

SPY +5.4%

QQQ +1.7%

IWM +12.7%

DIA +7.9%

SPX weekly chart

Below is a sector look at the different SPY groups which performed. You can see the outperformers were clearly XLE Energy, XLF Financials, and XLI Industrials, all up double digits. These sectors can be thought of as Value names. The S&P 500 is a market cap weighted index so the highest weighted sectors are made of of the largest companies by market cap, those happen to be XLK Tech (26.4%), and XLV Healthcare (13%), and XLY Consumer Discretionary (12.4%). That means these 3 sectors make up over half the SPX and the fact these 3 sectors were only up 2-4% during the quarter tells me if rotation comes back into them in Q2, the SPX index itself could grind higher than people think.

2021-04-01_7-24-10.png

Internals/Market Health:

Analyzing market breadth and internals is a big part of my process, both intraday and long term. The chart below shows the Cumulative Advance/Decline line for NYSE stocks. If there are 1000 more stocks advancing today than declining then that number is added to the cumulative total. You can see its been steadily rising along its 40 day EMA since the last year. The recent new high in the SPX, isn’t quite seeing the same breadth thrust to new highs as previous occurrences so it might be a slight warning flag but so far too early to tell. As long as this measure of market breadth stays above the 40 EMA I focus on finding strong stocks in strong sectors and riding the wave.

2021-04-02_11-52-34.png

Main Takeaways:

As a shorter term swing trader mostly, I focus on the week/month in front of me but I always like to keep the long term picture in mind. Seeing the forest from the trees is such an important concept to focus on as a trader. Trends last so much longer than anyone can imagine. They also can change swiftly in select stocks or sectors as 2021 has shown us. The big public winners of 2020 like TSLA and AAPL are having a tough time in 2021 but that is to be expected as stocks need to take a breather for months at a time to build up enough energy for their next run. Having a trend following approach has helped me stay on the right side of this market and utilizing something as simple as a 21 period moving average can help you stay with the momentum and trend. Looking at the QQQ chart below, even through the pullback in early 2021, the 21 week exponential moving average (blue line) held as buyers stepped in at that level multiple times. The Nasdaq was very stretched coming into February similar to last August/Sept when it got ahead of itself. When the rubber band gets too stretched, stocks revert to the mean. This is normal action and as long as buyers show up at the mean or average price of a certain timeframe, trends resume in the direction they came from.

QQQ Nasdaq weekly chart


Look Ahead to April and Beyond:

Per the Stock Traders Almanac, April seasonality has been strong over the years in the main stock market indices. April is the best month for the S&P and Dow since 1950. The Dow being up 15 straight Aprils with an average gain 2.9%. Prone to weakness after mid-month tax deadline. Stocks anticipate great first quarter earnings by rising sharply before earnings are reported, rather than after. Interestingly, the best 6 month period of the year end with April so a push to new highs during April could be met with the common ‘Sell in May” mantra.

With the Nasdaq coming off some first quarter weakness the potential to run higher into earnings is there before seeing a sell the news reaction into late April/early May. It will be interesting to watch which parts of the Tech sector lead higher, so far the Semiconductor names (SMH) have started off April with a bang and look primed to continue to new highs. Some of the stronger charts within the chip stocks are AVGO, TSM, ASML, AMAT, ADI, LRCX, INTC, ON.

The FAANG mega cap tech stocks which include FB, AAPL, AMZN, NFLX, GOOG have been resting for about 6 months in sideways patterns but are starting to really emerge out of consolidation patterns near support. If these names start new trends to the upside it could also really push Tech a bit higher than most are expecting. Markets move on sentiment and expectations. So the best moves happen when expectations are low and sentiment is not overly bullish. It seems in the short term that is the case in the Nasdaq so it would not surprise me to see the QQQ make new highs into April-May.


SMH Semiconductor etf with highest weighted stocks.

FAANG index with FB, AAPL, AMZN, NFLX, GOOG