Recap:
The first quarter of 2021 ended at the highs for the SPX, finishing up +5.4% even with all the drama surrounding interest rates and growth stocks. The SPX weekly chart below shows the 10 week moving average held as support most of the quarter with just one slip towards the 21 week EMA. As long as those levels continue to support the market on dips, it should make an attempt at that upper fibonacci extension level at 4136. The Nasdaq felt more of that pressure being exposed to interest rate changes yet the QQQ Nasdaq 100 finished the quarter +1.7% after being down as much as -5% at the lows before rebounding late March. However the real strength was in the small cap stocks and Dow Industrials. The IWM Russell 2000 index finished up +12.7% and the DIA Dow 30 up a solid +7.9%.
SPY +5.4%
QQQ +1.7%
IWM +12.7%
DIA +7.9%
SPX weekly chart
Below is a sector look at the different SPY groups which performed. You can see the outperformers were clearly XLE Energy, XLF Financials, and XLI Industrials, all up double digits. These sectors can be thought of as Value names. The S&P 500 is a market cap weighted index so the highest weighted sectors are made of of the largest companies by market cap, those happen to be XLK Tech (26.4%), and XLV Healthcare (13%), and XLY Consumer Discretionary (12.4%). That means these 3 sectors make up over half the SPX and the fact these 3 sectors were only up 2-4% during the quarter tells me if rotation comes back into them in Q2, the SPX index itself could grind higher than people think.

Internals/Market Health:
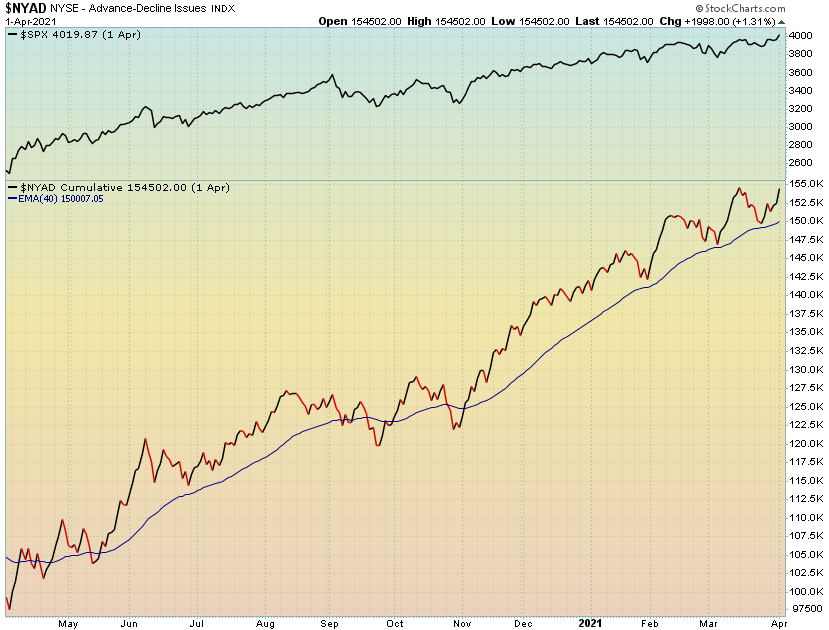
Analyzing market breadth and internals is a big part of my process, both intraday and long term. The chart below shows the Cumulative Advance/Decline line for NYSE stocks. If there are 1000 more stocks advancing today than declining then that number is added to the cumulative total. You can see its been steadily rising along its 40 day EMA since the last year. The recent new high in the SPX, isn’t quite seeing the same breadth thrust to new highs as previous occurrences so it might be a slight warning flag but so far too early to tell. As long as this measure of market breadth stays above the 40 EMA I focus on finding strong stocks in strong sectors and riding the wave.
Main Takeaways:
As a shorter term swing trader mostly, I focus on the week/month in front of me but I always like to keep the long term picture in mind. Seeing the forest from the trees is such an important concept to focus on as a trader. Trends last so much longer than anyone can imagine. They also can change swiftly in select stocks or sectors as 2021 has shown us. The big public winners of 2020 like TSLA and AAPL are having a tough time in 2021 but that is to be expected as stocks need to take a breather for months at a time to build up enough energy for their next run. Having a trend following approach has helped me stay on the right side of this market and utilizing something as simple as a 21 period moving average can help you stay with the momentum and trend. Looking at the QQQ chart below, even through the pullback in early 2021, the 21 week exponential moving average (blue line) held as buyers stepped in at that level multiple times. The Nasdaq was very stretched coming into February similar to last August/Sept when it got ahead of itself. When the rubber band gets too stretched, stocks revert to the mean. This is normal action and as long as buyers show up at the mean or average price of a certain timeframe, trends resume in the direction they came from.
QQQ Nasdaq weekly chart
Look Ahead to April and Beyond:
Per the Stock Traders Almanac, April seasonality has been strong over the years in the main stock market indices. April is the best month for the S&P and Dow since 1950. The Dow being up 15 straight Aprils with an average gain 2.9%. Prone to weakness after mid-month tax deadline. Stocks anticipate great first quarter earnings by rising sharply before earnings are reported, rather than after. Interestingly, the best 6 month period of the year end with April so a push to new highs during April could be met with the common ‘Sell in May” mantra.
With the Nasdaq coming off some first quarter weakness the potential to run higher into earnings is there before seeing a sell the news reaction into late April/early May. It will be interesting to watch which parts of the Tech sector lead higher, so far the Semiconductor names (SMH) have started off April with a bang and look primed to continue to new highs. Some of the stronger charts within the chip stocks are AVGO, TSM, ASML, AMAT, ADI, LRCX, INTC, ON.
The FAANG mega cap tech stocks which include FB, AAPL, AMZN, NFLX, GOOG have been resting for about 6 months in sideways patterns but are starting to really emerge out of consolidation patterns near support. If these names start new trends to the upside it could also really push Tech a bit higher than most are expecting. Markets move on sentiment and expectations. So the best moves happen when expectations are low and sentiment is not overly bullish. It seems in the short term that is the case in the Nasdaq so it would not surprise me to see the QQQ make new highs into April-May.
SMH Semiconductor etf with highest weighted stocks.
FAANG index with FB, AAPL, AMZN, NFLX, GOOG